
Index
Please cite the following paper(s) if you use BEAGLE 2.0 in your research:
-
Ballesio F., Teofani A., Carrino C., Catalano M., Nicolaeasa M.L., Ausiello G., Helmer-Citterich M., Gherardini P.F.(2025) BEAGLE 2.0: a web server for RNA secondary structure similarity detection leveraging SHAPE-directed RNA structure determination Journal of Molecular Biology, 169154, https://doi.org/10.1016/j.jmb.2025.169154
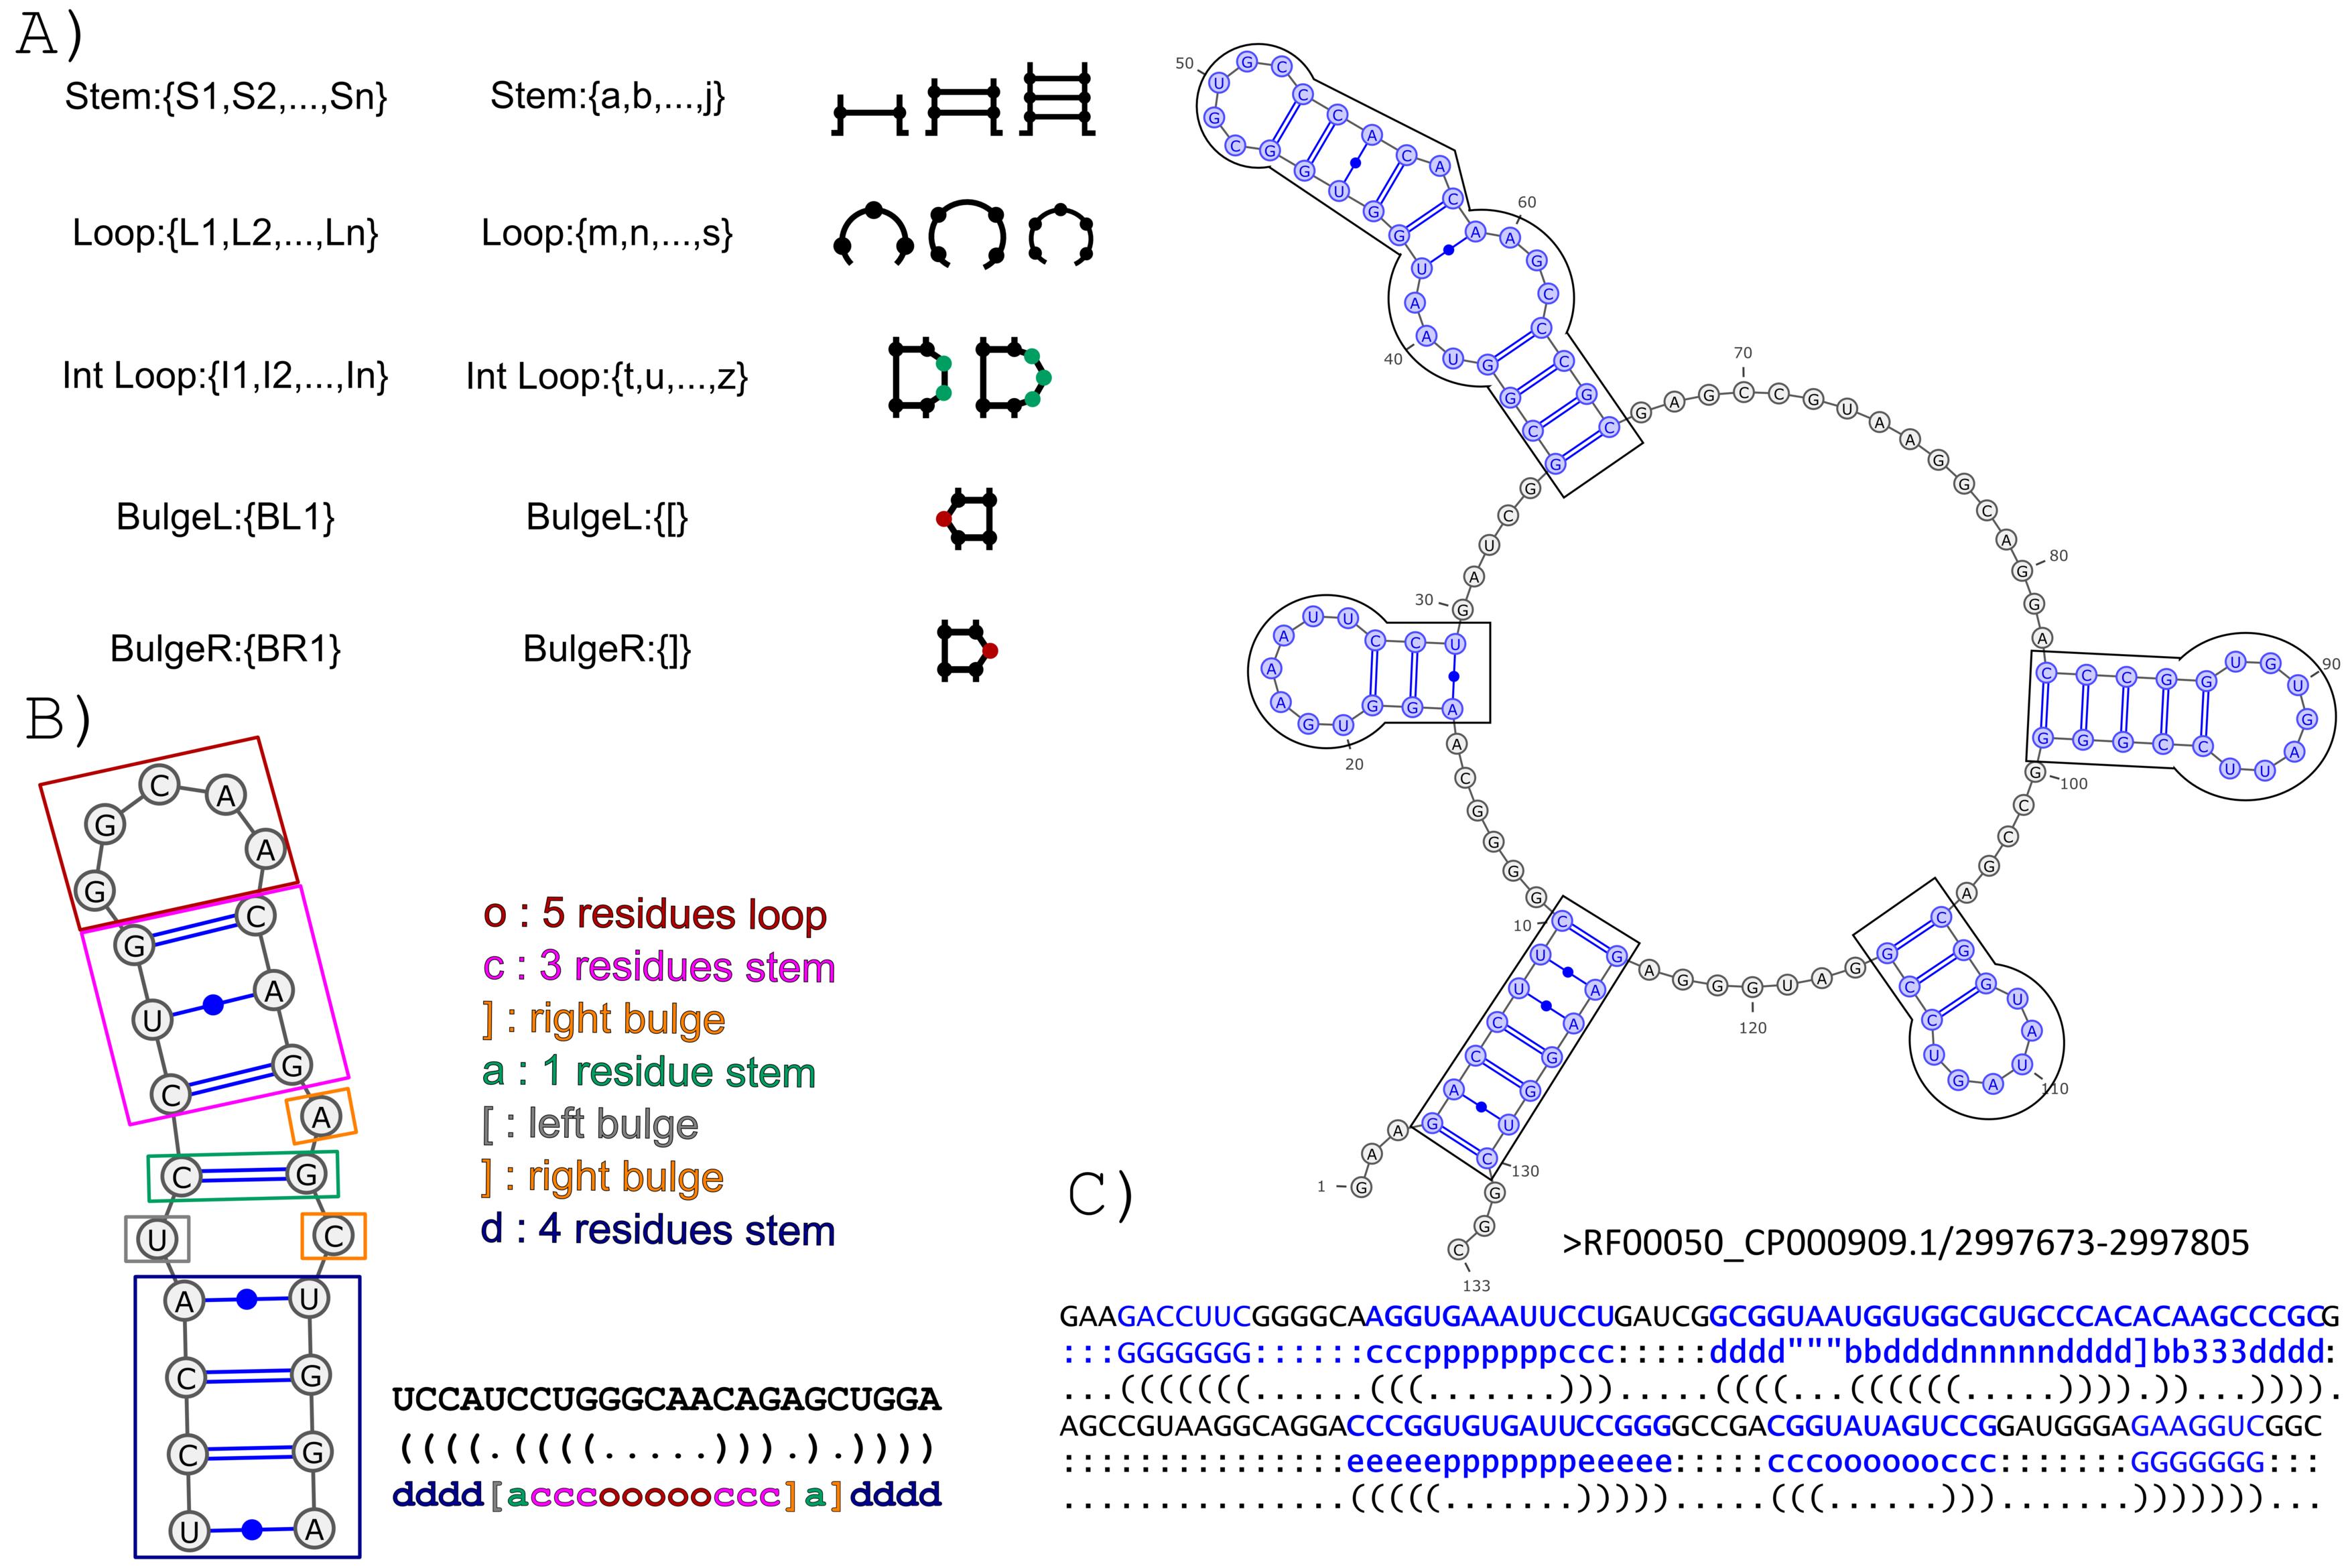
The BEAGLE (BEar Alignment Global and Local) web-server performs pairwise alignments of RNA secondary structure. The method exploits a new encoding for RNA secondary structure (BEAR) and a substitution matrix for RNA structural elements (MBR) (Mattei et al., 2014). The BEAR encoding allows to include structural information within a string of characters where each character of the encoding stores the information about the type and length of the secondary structure elements the nucleotide belongs to (Fig. 1).
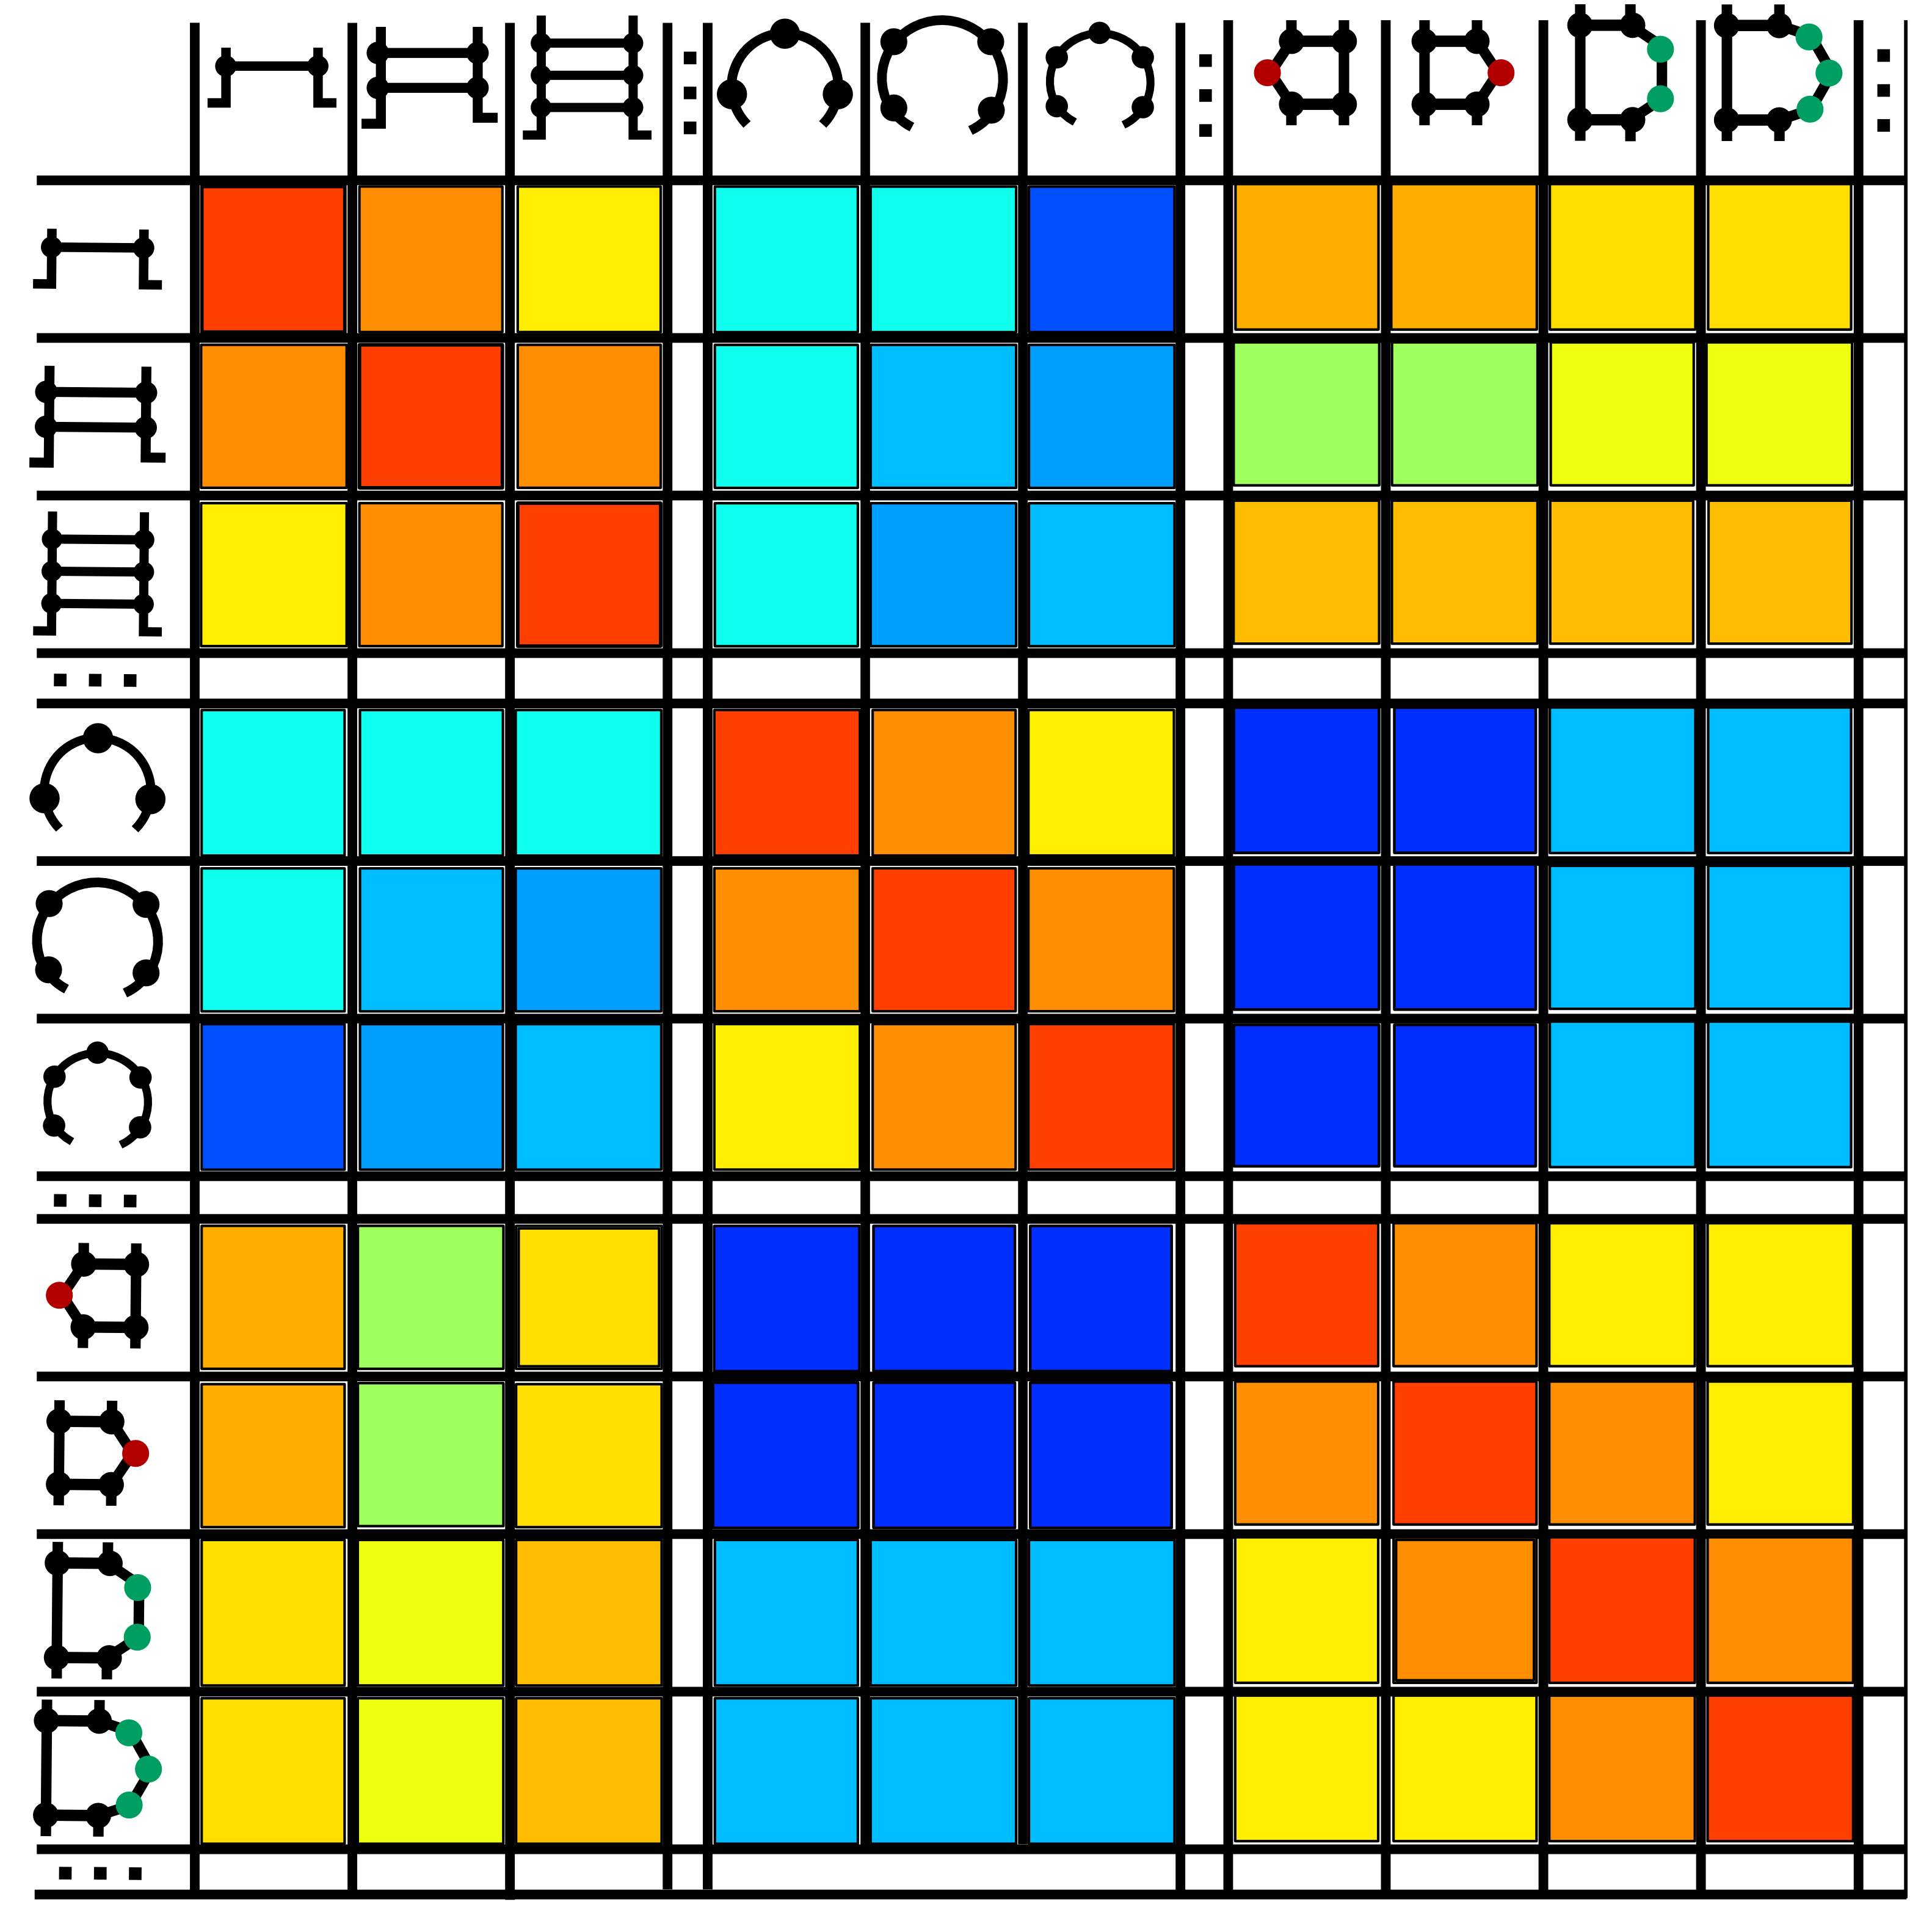
Transition rates between secondary structure elements were computed on a set of evolutionally related BEAR-encoded RNAs (Fig.2).
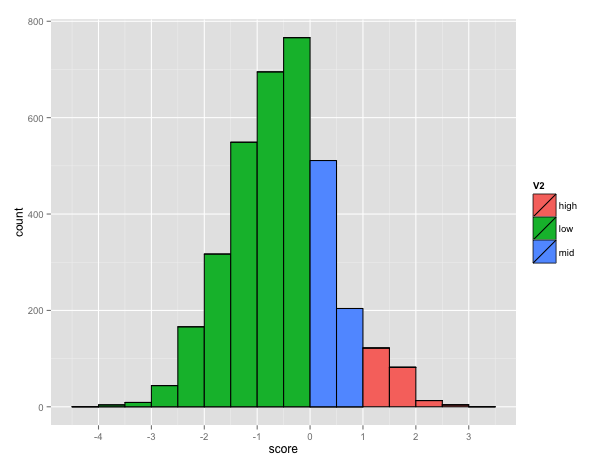
The BEAR encoding uses an alphabet of 83 characters so the size of the MBR is 83x83. The total number of possible pairs is 3486 (83*(83+1)/2) among which 221 has a score higher than 1, corresponding to pairs occurring more than expected. The plot below shows the distribution of the score in the matrix (Fig. 3).
The BEAGLE method implements a modified version of the the Needleman-Wunsch algorithm for global alignment and the Smith-Waterman algorithm for local alignment, for the comparison of BEAR-encoded RNA secondary structures, using the MBR (or any other user-provided substitution matrix for BEAR characters) to guide the alignment.
Transition rates between secondary structure elements were computed on a set of evolutionally related BEAR-encoded RNAs (Fig.2).
The BEAR encoding uses an alphabet of 83 characters so the size of the MBR is 83x83. The total number of possible pairs is 3486 (83*(83+1)/2) among which 221 has a score higher than 1, corresponding to pairs occurring more than expected. The plot below shows the distribution of the score in the matrix (Fig. 3).
The BEAGLE method implements a modified version of the the Needleman-Wunsch algorithm for global alignment and the Smith-Waterman algorithm for local alignment, for the comparison of BEAR-encoded RNA secondary structures, using the MBR (or any other user-provided substitution matrix for BEAR characters) to guide the alignment.
BEAGLE offers three kinds of comparisons:
- One set This option accepts one set of RNAs as input and the server will perform all the possible pairwise alignments among those RNAs. Maximum 300 RNAs accepted in input. The input sequences must be supplied using the textarea.
- Two sets This option accepts two sets of RNAs, namely the query and target set. The sequences in the query set will be aligned to the sequences in the target set. Each RNA in the query set will be aligned with each RNA in the target set producing n x m alignments where n is the cardinality of the query set and m is the cardinality of the target set. The input sequences must be supplied using the two textareas.
- Search Using this option, an input RNA will be compared to one of the pre-compiled RNA datasets. For more information about the available datasets see the datasets section.
All the comparison options required the input sequences to be supplied using the textarea in the home page.
Note: The minimum accepted sequence length, for each comparison method, is 10 nucleotides!
The input sequences are accepted in FASTA format:
-The line containing the name and/or the description of the sequence starts with a ">";
-The words following the ">" are interpreted as the RNA id;
-The following line reports the RNA nucleotide sequence; -The subsequent line characters are interpreted as secondary structure information (Optional)
or
FASTB format:
-The line containing the name and/or the description of the sequence starts with a ">";
-The words following the ">" are interpreted as the RNA id;
- The following line reports the RNA nucleotide sequence;
-The subsequent line characters are interpreted as secondary structure information in the BEAR alphabet.
The IUPAC notation is accepted for nucleotides (case-insensitive).
The secondary structure must be supplied using dot-bracket notation; only '( . )' characters will be accepted by the program.
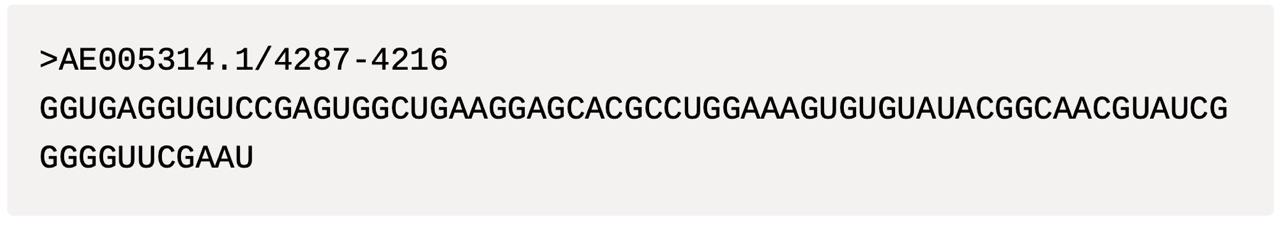
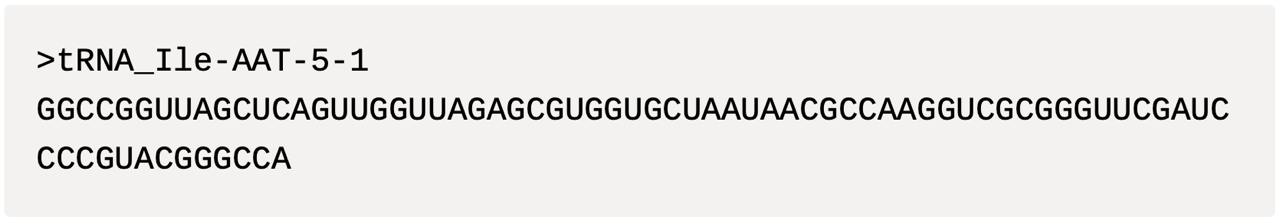
Example of a well formatted input file:
>X06054.1/711637
GGGCCCGUCGUCUAGCCUGGUUAGGACGCUGCCCUGACGCGGCAGAAAUCCUGGGUUCAAGUCCCAGCGGGCCCA
In this case the secondary strucure for the sequence will be computed on the fly using RNAfold (Vienna package), with the minimum free energy prediction method.
or
>X06054.1/711637
GGGCCCGUCGUCUAGCCUGGUUAGGACGCUGCCCUGACGCGGCAGAAAUCCUGGGUUCAAGUCCCAGCGGGCCCA
(((((((..((((..........)))).(((((.......))))).....(((((.......)))))))))))).
or
>X06054.1/711637
GGGCCCGUCGUCUAGCCUGGUUAGGACGCUGCCCUGACGCGGCAGAAAUCCUGGGUUCAAGUCCCAGCGGGCCCA
(((((((..((((..........)))).(((((.......))))).....(((((.......)))))))))))).
GGGGGGG::ddddssssssssssdddd:eeeeepppppppeeeee:::::eeeeepppppppeeeeeGGGGGGG:
The input may contain many sequences e.g. :
>X06054.1/711637
GGGCCCGUCGUCUAGCCUGGUUAGGACGCUGCCCUGACGCGGCAGAAAUCCUGGGUUCAAGUCCCAGCGGGCCCA
(((((((..((((..........)))).(((((.......))))).....(((((.......)))))))))))).
GGGGGGG::ddddssssssssssdddd:eeeeepppppppeeeee:::::eeeeepppppppeeeeeGGGGGGG:
>AP000063.1/5917959095
GCGGGGGUGCCCGAGCCUGGCCAAAGGGGUCGGGCUCAGGACCCGAUGGCGUAGGCCUGCGUGGGUUCAAAUCCCACCCCCCGCA
(((((((..(((.............))).(((((.......)))))..............(((((.......)))))))))))).
>AP000989.1/7327973354
GCGGCCGUCGUCUAGUCUGGAUUAGGACGCUGGCCUUCCAAGCCAGUAAUCCCGGGUUCAAAUCCCGGCGGCCGCA
(((((((..((((...........)))).(((((.......))))).....(((((.......)))))))))))).
>AE006696.1/291218
GCCGCCGUAGCUCAGCCCGGGAGAGCGCCCGGCUGAAGACCGGGUUGUCCGGGGUUCAAGUCCCCGCGGCGGCA
(((((((..((((.........)))).(((((.......))))).....(((((.......)))))))))))).
GAP INSERTION
Cost of starting a gap in the alignment
GAP EXTENSION
Cost of extending an alignment gap.
SEQUENCE BONUS
Extra score for aligning two identical nucleotides.
GLOBAL/LOCAL
Allows the user to choose between global and local alignment
DATASETS (only for "Search" comparison option)
Allows the user to choose one of the pre-compiled datasets. Graphical output will not be available for this option.
The searchable secondary structure datasets were divided into three groups: those derived from icSHAPE, NONCODE, and Rfam data. The first dataset, based on experimental data, is the most reliable. The NONCODE dataset was included to allow research across a wider range of species. The Rfam dataset, which was also used in the initial version of Beagle, has been updated to Rfam seed version 15.0 and relies on the conservation of positions within Rfam families for its reliability. All the comparison options required the input sequences to be supplied using the textarea in the home page.
| Accession ID | Organism | Cell line | Transcript type | Reference | Number of RNAs | Library strategy | Condition | Reagent |
|---|---|---|---|---|---|---|---|---|
| GSE145805 | Homo sampiens | HEK293 | PolyA+ | Sun et al., 2021 | 73,069 | icSHAPE | in vivo | NAI-N3 |
| GSE145805 | Homo sampiens | H9 | PolyA+ | Sun et al., 2021 | 72,697 | icSHAPE | in vivo | NAI-N3 |
| GSE145805 | Homo sampiens | K562 | PolyA+ | Sun et al., 2021 | 66,042 | icSHAPE | in vivo | NAI-N3 |
| GSE145805 | Homo sampiens | HeLa | PolyA+ | Sun et al., 2021 | 61,066 | icSHAPE | in vivo | NAI-N3 |
| GSE145805 | Homo sampiens | HepG2 | PolyA+ | Sun et al., 2021 | 48,491 | icSHAPE | in vivo | NAI-N3 |
| GSE145805 | mEs | HepG2 | PolyA+ | Sun et al., 2021 | 26,756 | icSHAPE | in vivo | NAI-N3 |
| GSE146952 | Homo sapiens | HEK293t | small RNAs | Luo et al. 2021 | 299 | SHAPE-MaP | in vivo | NAI-N3 |
| GSE120724 | Danio rerio | Fertilized eggs | PolyA+ | Shi et al. 2020 | 7,033 | icSHAPE | in vivo | NAI-N3 |
| GSE120724 | Danio rerio | 1 cell (0,4 hpf) | PolyA+ | Shi et al. 2020 | 7,033 | icSHAPE | in vivo | NAI-N3 |
| GSE120724 | Danio rerio | 4 cells (1 hpf) | PolyA+ | Shi et al. 2020 | 5,013 | icSHAPE | in vivo | NAI-N3 |
| GSE120724 | Danio rerio | 64 cells (2 hpf) | PolyA+ | Shi et al. 2020 | 5,138 | icSHAPE | in vivo | NAI-N3 |
| GSE120724 | Danio rerio | Sphere (4 hpf) | PolyA+ | Shi et al. 2020 | 5,024 | icSHAPE | in vivo | NAI-N3 |
| GSE120724 | Danio rerio | Shield (6 hpf) | PolyA+ | Shi et al. 2020 | 4,879 | icSHAPE | in vivo | NAI-N3 |
| GSE154563 | Escherichia coli (K-12 DH10B) | K-12 DH10B | rRNA 16s, 23s | Marinus et al., 2021 | 2 | SHAPE-MaP | in vivo | 2A3 |
| GSE154563 | Bacillus subtilis (168) | K-12 DH10B | rRNA 16s, 23s | Marinus et al., 2021 | 2 | SHAPE-MaP | in vivo | 2A3 |
| GSE106483 | Dengue Virus (EDEN-2402) | Vero | Genome | Huber et al., 2019 | 1 | SHAPE-MaP | in vivo | NAI |
| GSE106483 | Dengue Virus (EDEN-3295) | Vero | Genome | Huber et al., 2019 | 1 | SHAPE-MaP | in vivo | NAI |
| GSE106483 | Dengue Virus (EDEN-2270) | Vero | Genome | Huber et al., 2019 | 1 | SHAPE-MaP | in vivo | NAI |
| PRJEB28648 | Zika virus (MR766) | Huh-7 | Genome | P. Li et al. 2018 | 1 | icSHAPE | in vivo | NAI-N3 |
| PRJEB28648 | Zika virus (PRVABC 59) | Huh-7 | Genome | P. Li et al. 2018 | 1 | icSHAPE | in vivo | NAI-N3 |
| GSE189259 | SARS-CoV-1 | Vero E6 | Genome | Morandi et al, 2022 | 1 | SHAPE-MaP | in vivo | 2A3 |
| GSE189259 | SARS-CoV-2 | Vero E6 | Genome | Morandi et al, 2022 | 1 | SHAPE-MaP | in vivo | 2A3 |
| GSE153984 | HCoV-HK U5 | Huh 7.5.1 | UTRs | Lan, T.C.T. et al, 2022 | 2 | icSHAPE | in vivo | NAI-N3 |
| GSE153984 | HCoV-HK U9 | Huh 7.5.1 | UTRs | Lan, T.C.T. et al, 2022 | 2 | icSHAPE | in vivo | NAI-N3 |
| GSE153984 | HCoV-HK U1 | Huh 7.5.1 | UTRs | Lan, T.C.T. et al, 2022 | 2 | icSHAPE | in vivo | NAI-N3 |
| GSE153984 | HCoV-NL 63 | Huh 7.5.1 | UTRs | Lan, T.C.T. et al, 2022 | 2 | icSHAPE | in vivo | NAI-N3 |
| GSE153984 | MERS-CoV | Huh 7.5.1 | UTRs | Lan, T.C.T. et al, 2022 | 2 | icSHAPE | in vivo | NAI-N3 |
To enhance clarity and transparency regarding sequencing coverage and quality control, we have included this table that provides a summary of the coverage thresholds and quality control measures implemented in the original studies, as well as the filtering criteria applied, allowing users to easily verify how SHAPE data were processed.
| Accession ID | Reference | Coverage Threshold | Quality control measures |
|---|---|---|---|
| GSE145805 | Sun et al., 2021 | >50,000 transcripts in human; >30,000 transcripts in mouse |
Background correction with DMSO-treated samples, entropy-based filtering and winsorization. The scores of each peak were normalized to a scale of [0, 1] |
| GSE153984 | Lan, T.C.T. et al. 2022 | >100,000 reads per region (sliding window of 500 nt) | Background correction with DMSO-treated samples, winsorization and removal of low-confidence positions. The scores of each peak were normalized to a scale of [0, 1] |
| GSE146952 | Sun et al., 2021 | >500 per nucleotide | Background correction with DMSO-treated samples, removal of low-confidence positions and structural score computation using mutation rates |
| GSE120724 | Marinus et al. 2021 | Coverage threshold not explicitly stated | Background correction with DMSO-treated samples and removal of low-confidence positions (Phread < 20) |
| GSE106483 | Huber et.al 2019 | >100 reads per base on 99.99% of all bases across eight viruses | Background correction with DMSO-treated samples, Shannon entropy-based filtering, correlation-based validation of replicates (Pearson > 0.81) and comparison with known structural elements |
| PRJEB28648 | Li et al. 2018 | Coverage threshold not explicitly stated | Background correction with DMSO-treated samples, icSHAPE data normalization using a global median-based approach and cross-validation using independent biological replicates (Pearson correlation R ≥ 0.89) |
| GSE189259 | Morandi et al., 2022 | Coverage threshold not explicitly stated | Background correction with DMSO-treated samples, filtering of low-complexity regions using the Gini coefficient, normalization of SHAPE reactivities and validation using COMRADES-supported RNA–RNA interactions |
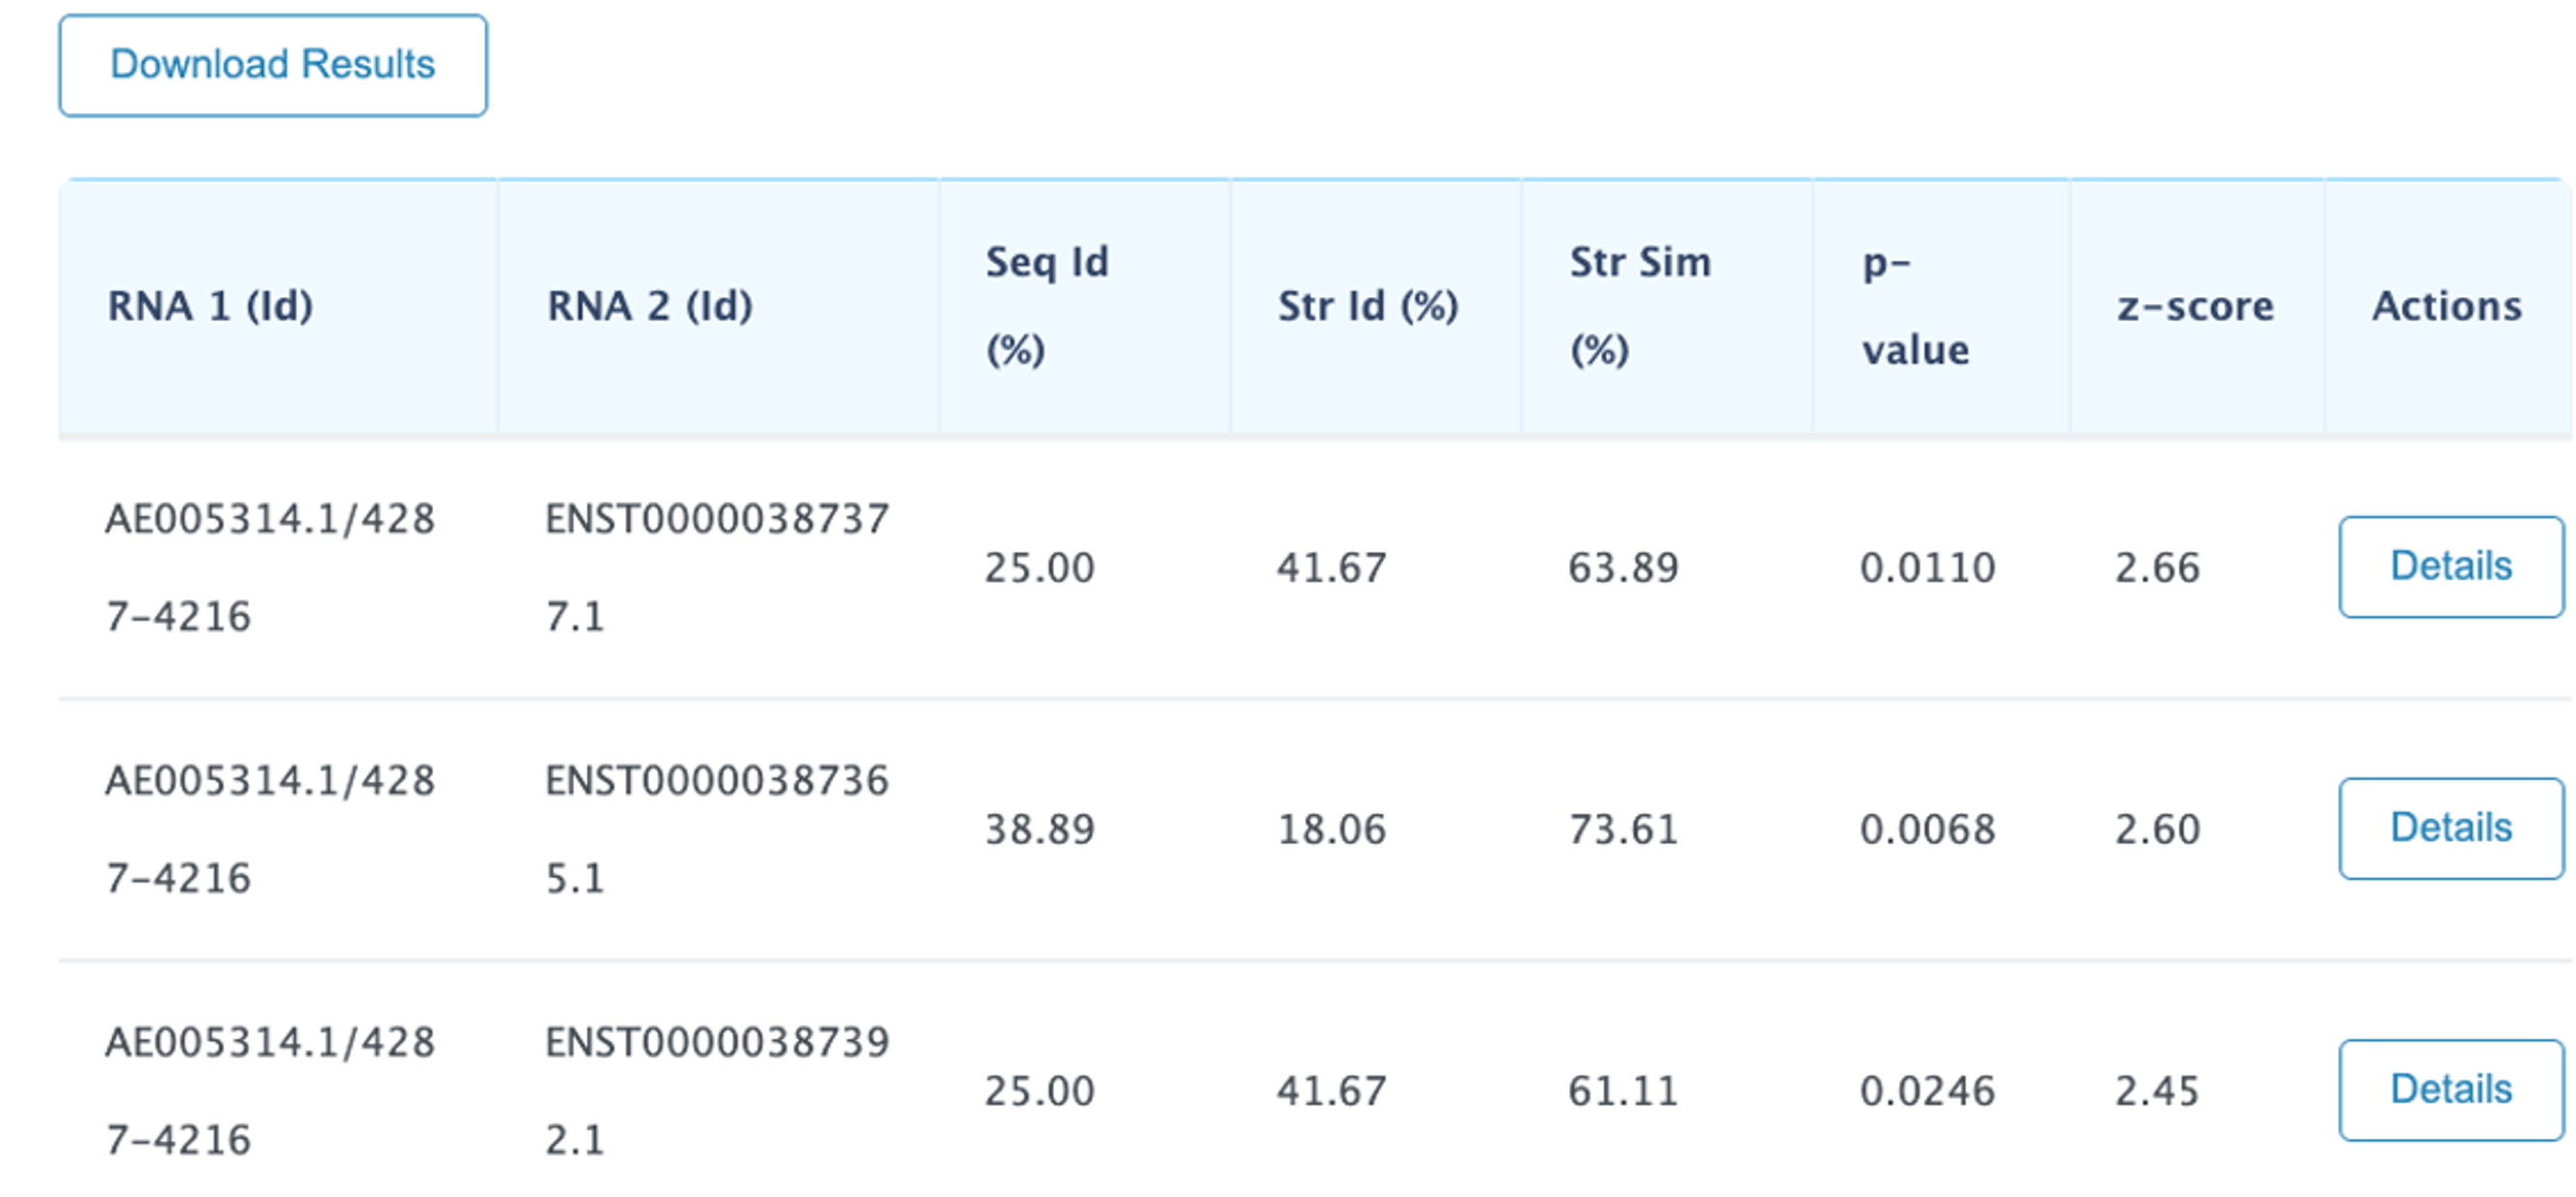
The results page reports a table containing all the computed pairwise alignments .Each row of the table contains the two input RNA ids and alignment statistics such as sequence and structural identity percentages and the structural similarity percentage. Moreover, also two measures for the statistical significance of the alignments are reported: p-value and z-score. Results can be sorted according to one of the previous parameters by clicking the selected column header. by default the results are displayed sorted by z-score in ascending order.
Description of the output fields:
The NW W (Needleman and Wunsch): Needleman-Wunsch alignment score for the RNA primary sequences
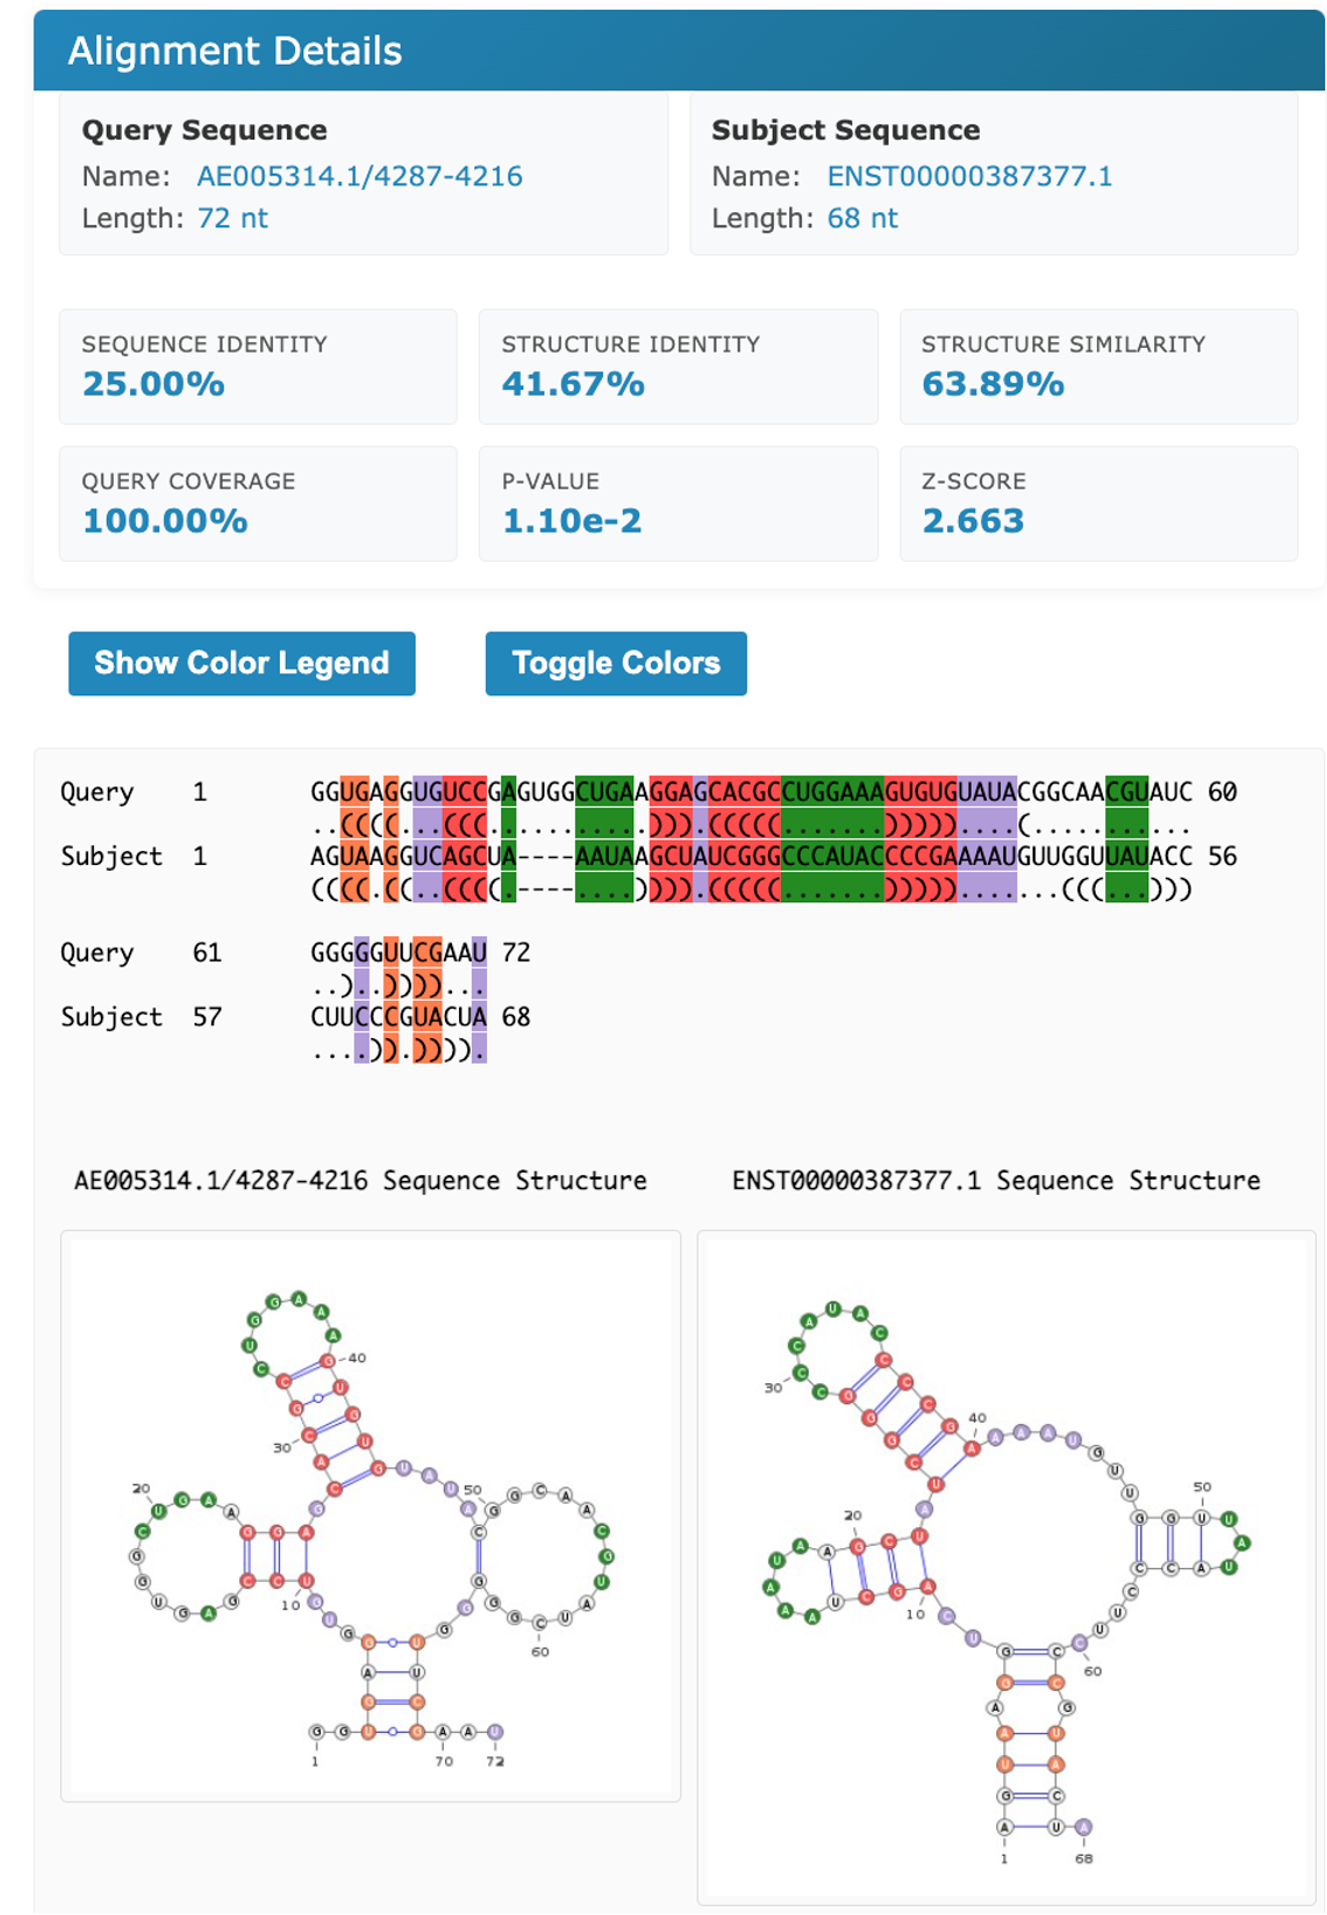
The SeqIdentity y (Sequence identity percentage) is computed as the fraction of paired nucleotide bases.
The Str Id (structural identity percentage) is computed as the fraction of paired bases encoded with an identical BEAR character.
The Str Sim (structural similarity percentage) is computed as the fraction of paired bases encoded with two different BEAR characters belonging to the same RNA structural element (e.g. two different characters encoding for stems with different lengths).
The p-value and z-score are computed using as background the distribution of the scores obtained aligning unrelated RNA sequences (as detailed in the Supplementary Material of Mattei et al. , sumbitted). We suggest to consider the z-score as the reference statistic measure and consider as significant all the alignments having a z-score higher than 3.
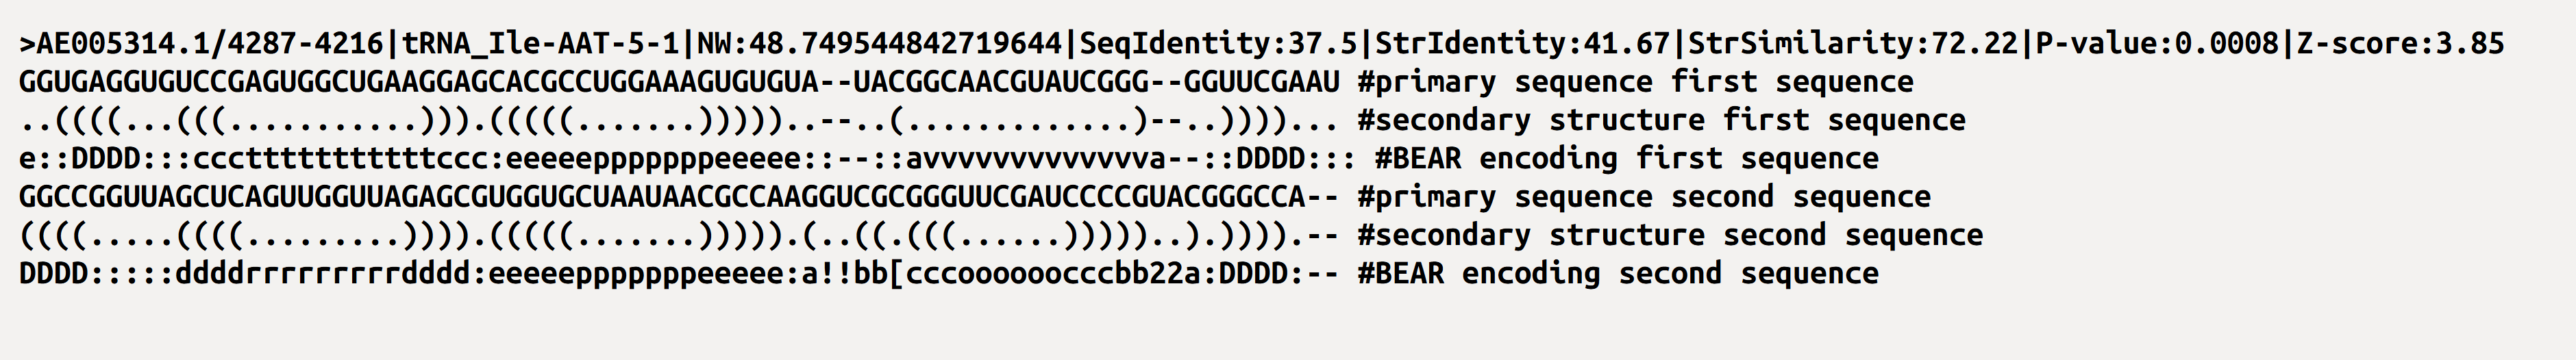
By clicking on Download Results, it is possible to download all the pairwise alignments. The exported file will be formatted in a FASTA-like format as follow:
-The first line containing starts with a ">" followed by the ID of the first sequence, the ID of the second and the alignment scores, the sequence identity percentage, the structural identity percentage, the structural similarity percentage, P-value and Z-score. The fields are divided by '|'
-Next line represents the aligned nucleotide sequence of the first RNA
-Next line represents the aligned secondary structure of the first RNA
-Next line represents the aligned BEAR characters of the first RNA
-Next line represents the aligned nucleotide sequence of the second RNA
-Next line represents the aligned secondary structure of the second RNA
-Next line represents the aligned BEAR characters of the second RNA
Example:
Input1: